
Using Revenue Commissioners data, Cliff Taylor shows there are a lot of taxpayers on very high incomes.
‘The number of taxpayers earning more than €150,000 will rise to close to 200,000 next year, from 80,000 in 2020, while over the same period the number of €200,000-plus earners has grown from 41,000 to almost 109,000 . . . higher-income households are now larger and more economically powerful.’ (bold own)
High-earners growing, in both numbers and power.
So let’s check in on the 1% – the top 1% earners in the economy. How are they doing?
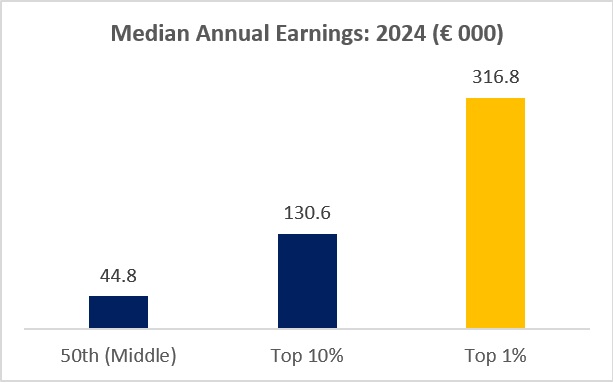
Whereas middle-income employees earn €44,800, the top 1% take in €316,800 and earn twice as much as the high-income top 10% group. And that gap is growing. Between 2014 and 2024:
- Average earnings grew by 34%
- Earnings in the top 10% grew by 48%
- Earnings in the top 1% grew by 59%
So the next time someone tells you the rich get richer, don’t dismiss it as a cliché. It is there in the data.
However, this only provides part of the picture. In addition to earnings (wages and salaries), households also generate capital income. This is where the 1% really shines.
Capital Income
To capture capital income we can turn to the CSO’s Survey of Income and Living Conditions (SILC). Unfortunately, we don’t have data for the top 1% – only for the top 10%. Capital income is captured in the category of Other Market Income which includes rents, financial interest, dividends, and profits. It also includes income for under-16s, foreign pensions, and retirement and redundancy lump sums – though these wouldn’t make up much. Given the mixture of income sources, this should be treated indicatively.
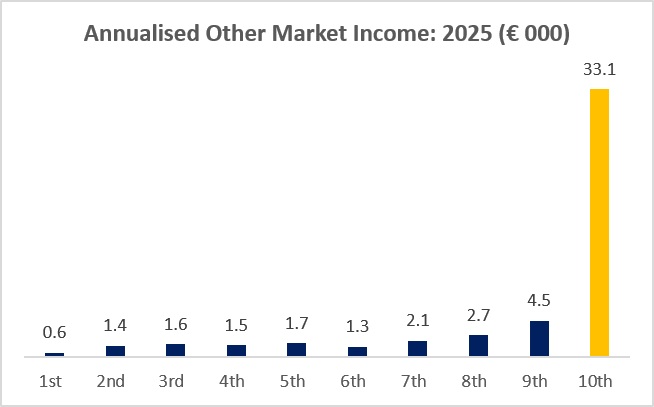
Annualising the weekly income, we find that the highest income group (the 10th decile) received over €33,000 in capital income. All other deciles received considerably less, with the rest of the population averaging €1,900.
And the gap between the top 10% and the rest of us is growing.
- Between 2020 and 2025, capital income increased by 67% across all households
- In that same period capital income for the top decile nearly doubled, increasing by 96%.
There is other data. For instance, the comprehensive World Inequality Database finds that the top 1% own 23% of all assets in the state (property, shares, bonds, land, cash – minus debts). However, this doesn’t refer to the top 1% of income earners; it refers to the top 1% of wealth holders. Nonetheless, there would be considerable overlap.
Further, Public Policy.ie apparently found that the top 1% of capital income recipients take in 31% of all capital income generated in the state. Unfortunately, this study dates back to 2016 and is seemingly not accessible on the website.
* * *
The first reaction for many will be to ‘tax them’. Nothing wrong with that. If we can’t soak them at least give them a good splash.
But the data above – earnings and capital income – are all pre-tax. The inequality is embedded in the economy itself. We can, and do, reduce inequality through taxes and social protection benefit, but this entails a cost. We need to go beyond tax and spend and address the actual causes within the economy.
We need structural strategies to tackle the market inequality between the 1% crowd and the rest of us. Some examples from a non-exhaustive list: raise wage floors, introduce sectoral collective bargaining alongside enterprise-level bargaining, cap CEO pay as a ratio of employees, price regulation, strengthen in-work benefits (especially family benefits), de-commodify public services (childcare, housing, primary health, public transport, education), etc.
Bring on Budget 2027.
 Notes on the Front
Leave a comment