
 In the last post, I suggested that some of the arguments regarding the relative poverty measurement were starting to be answered. Now let’s start some new arguments – but, as always, in a positive way; namely, how much tax do those on high incomes pay and is it enough or too much.
For some time, many commentators having been making claims that a small proportion of ‘those at the top’ are paying the lion’s share of taxes. This leads some to conclude that (a) tax at the top is already too high and, (b) that the Irish tax system is highly progressive.
Based on the evidence to support those contentions, we should be dubious – mucho dubious. In fact, it can be argued that the highest income groups don’t really pay all that much tax relative to their income position; and that the Irish tax system is not all that progressive.
So let’s take a whirlwind tour of some of the stats that are fired around the place and see what sense we can make of them, bearing in mind that it is hard to get to grips with issues of income, wealth and tax distribution; for the simple reason we don’t have a single or series of consistent data sources (on wealth, almost nil). For anyone trying to piece together bits from here and there – it is never going to be a satisfactory state of affairs.
A number of commentators use the Revenue Commissioners’ Income Distribution Statistics table (this link is courtesy of Peter Connell from Progressive-Economy which provides an individualisation of Revenue data that groups couples' income together).
Revenue data shows that a small group of income earners pay a disproportionate amount of tax. From this we could conclude that high income groups (a) pay a disproportionate amount of all tax paid and (b) pay a high average tax ratio. To put it in perspective, according to the Revenue tables, while the top 1 percent income earners pay an average income tax rate of a third, average income earners pay an average of less than half that – 14 percent. All in all, a progressive system.
But using this data should come with a health warning. There is much that is not included in this data. For instance, this only assesses income for the purposes of income tax. It doesn’t include capital income (capital gains, inheritances, gifts, trust income, etc.). Even for the purposes of income tax, it doesn’t include a considerable amount of income. Revenue lists some of the income, profits or gains it doesn’t include:
superannuation contributions * stallion fees * profits from commercial forestry * patent royalties * investment income arising from personal injuries * child benefit, * maternity benefit * unemployment assistance * writers, composers and artists * bonus or interest paid under Instalment Savings Schemes operated by An Post * interest on certain Government securities, certain foreign pensions * portion of certain lump sums received by employees on cessation of their employment * statutory redundancy payments and certain military pensions * interest income that does not need to be declared or is not recorded (but from which tax has been deducted) * unemployment benefit and disability benefit * incomes of certain self-employed persons, including some farmers * etc.
These are just a few. The Commission on Taxation lists a rake of others which may not be included in the Revenue Commissioners income compilation. All this to say that the Revenue tables cannot be relied on to assess either the average tax rate or the proportion of tax paid – especially for high income earners – as there is income that is not included.
There are further problems.
Proprietary directors have the ability to legally hide income in their business and retrieve it in tax efficient manner – for instance, through pension funds. Such mechanisms can considerably reduce the average tax rate for high income earners. Further, the Revenue tables don’t show social insurance payments, which are reduced for high income earners owing to the contribution ceiling (never mind that PRSI is not levied on capital income). And, of course, the tables don’t show the payment of VAT which is regressive.
Using the Revenue tax tables as a proxy for the progressivity of the tax system is, therefore, fraught with problems. Is there a more accurate assessment of the distribution of tax and income?
EU Survey of Income and Living Conditions: Equivalised Income
There is no single data source, nor one that would be universally accepted. However, the EU Survey of Income and Living Conditions can give us some pointers – as it includes more income and more tax. Of course, it is a survey – it involved interviewing 5,247 households and 12,551 individuals. It is voluntary and, of necessity subjective. Still, it is accepted as a reliable data source throughout the EU. So let’s see what it tells us.
The first measurement is the equivalised income for each household. The reason for equivalisation is that household measurements don’t take account of how many people or income earners are in a household. For instance, in the highest income group (10th decile), there are an average of 3.67 persons in the household, with nearly 60 percent at work. In the lowest decile (1st), there are only 1.2 persons in the household with only a fraction at work. Therefore, comparing household income, while valid in some circumstances, can only tell us so much. Equivalence scales attempt to even these out (these scales are listed on page 98).
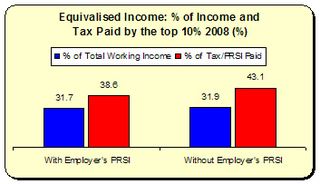 SILC data includes employer’s PRSI as part of income and tax paid. This may seem unusual but there is a valid reason for this. Employer’s PRSI is considered an in-kind payment on behalf of the employee, for benefits they would not otherwise receive (pension, sickness, unemployment, etc.). Further, under the CSO calculation, employers’ PRSI includes payments for private health insurance and life assurance – so it is clearly a valid in-kind income inclusion. However, I have extracted out the employer’s PRSI to give a comparison. Doing this we find that:
- The top 10 percent earn 31.7 percent of income and pay 38.6 percent of tax/PRSI (employer’s PRSI included). This is a long ways from the Revenue tables.
- The top 10 percent earn 31.9 percent of income and pay 43.1 of tax/PRSI (employer’s PRSI excluded). Still a long ways away from the Revenue tables.
Under either calculation, the Irish tax system cannot be deemed to uber-progressive. Earning 32 percent of all income and paying 39 percent all tax/PRSI is at the softer end of progressive (below we’ll see that even these figures don’t take account of the full income/tax picture).
Household Income
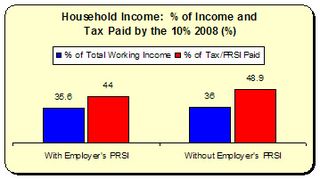 The second measurement is that of household income. As stated above, we have to be careful using this. For instance, the top 10 percent of households contain 19.1 percent of all those working. But let’s see what this tells us.
- With employers’ PRSI, the top 10 percent of households (nearly 20 or the working population) earn 36 percent of working income and pay 44 percent of all tax.
- Without employers’ PRSI, the top 10 percent earn 36 percent of income and pay 49 percent of all tax.
Again, there is a progressivity present – but not overly so, something that becomes more apparent from our next calculation.
Average Tax Rate
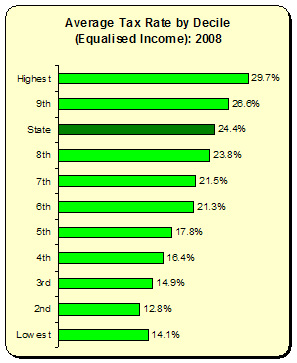 So what is the average tax rate for each of the decile groups? Here we chart the average rate and find that the highest decile group pays 30 percent of their income on tax. However, we also find that the national average is 24 percent – so the gap between the highest and average is not all that much. Indeed, we see that those in the middle 6th decile pay 21 percent, even though this group average less than a third of income than the highest income group. This is progressive – but only slightly so.
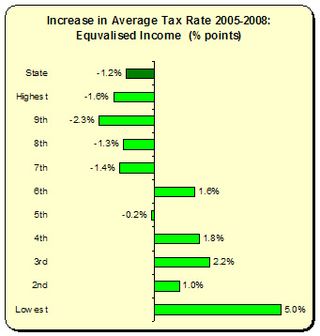
What’s also interesting is the change in the average tax rate between 2005 (the first year the CSO used equavalised income). We see that the average rate nationally fell by -1.2 percent. The higher income decile groups all experienced above-average tax decreases. However, those at the lower end experienced tax increases (though I wouldn’t put much emphasis on the 5 percent figure in the lowest decile since we are dealing with a very small working-cohort sample).
So whatever about our ‘progressive tax system’ – it has become less progressive over the last few years up to 2008.
 Even here, there are major omissions from the SILC data. Notably, it does not include once-off income increases; in particular inheritances and gifts; it is reasonable to assume this revenue is higher at the higher income levels. And since it doesn’t include these capital income sources, it doesn’t include the tax – which is much lower than on labour. The lack of data on such gains precludes us from trying to graft that on the SILC data. However, we can attempt to add – for illustrative purposes – another tax that is omitted from both the Revenue and SILC tables: VAT and Excise.
VAT and Excise
In 2010, Vat and Excise is estimated to bring in €15 billion; income tax (including the income levy) will bring in €12 billion. To exclude this tax from any calculation on the average tax ratio is a critical omission.
Unsurprisingly, Vat and Excise are highly regressive. The ESRI and the Combat Poverty Agency found that those on the lowest income groups paid more than twice the percentage of their gross income on indirect taxes than those on the highest incomes (20.8 percent to 9.6 percent).
 The following applies the findings of the ESRI/CPA to the SILC data. This is not wholly satisfactory. First, we are dealing with different data sources. Second, the indirect tax data was published in 2005 based on the 2000 Household Budget Survey – so it is a bit dated. However, VAT rates have not changed all that much since then. Still, this should be seen as illustrative.
In order to stay faithful to the ESRI/CPA findings – the following will assess the total income and tax on households. Therefore, this will include income from both work and social transfers. Doing this we find that the top 10 percent
- receive 30 percent of all income and pay 32 percent of all tax, including VAT and Excise.
Remember, this is a household measurement, so this represents 13 percent of all people, not just those working).
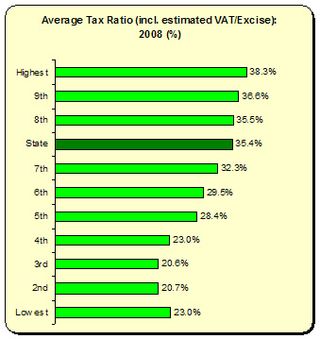
This hardly lends itself to the notion of a highly progressive tax system. Nor does the following estimation. While the national average tax ratio is 35.4 percent, the average ratio for the top decile is less than three percent higher. If this is progressivity, it is of only the mildest kind.
* * *
We’ve come a bit a distance in this post so let’s recap. Using the Revenue tables to deduce the average tax ratio for different income groups or the amount of total tax paid by high income groups is a mistake. These tell us only so much. Working with the SILC tables (which still have limitations, notably the exclusion of significant capital income) we find that
- The highest 10 percent income group receives 32 percent of all income and pays 39 percent using the equivalised scales.
- Using household income, the top 10 percent (which represents nearly 20 percent of all those working) we find this group earning 36 percent of all working income and paying 44 percent of all tax/PRSI.
- Those in the highest income deciles saw their average tax ratio fall between 2005 and 2008 while most other deciles experienced a rise.
- When VAT and Excise is included, the highest household group, while receiving 30 percent all income (working and social transfers) pay only 32 percent of all tax.
- The average tax ratio, including VAT and Excise, for the highest household decile group is only marginally above the national average.
I want to emphasise very clearly: this is not the last word. As I said at the beginning, trying to come up with a comprehensive distribution of all income and all tax paid is a difficult exercise. You have to piece together data from different sources. There are legitimate differences over the various methods used.
What is obvious is that we need a lot more information from a lot more consistent sources to come to any firm conclusions about income distribution and taxation.
But on the data have used, there is a serious question over the progressivity of the Irish taxation system.

Leave a comment