
 There are a few subjects that are guaranteed to start rows. Public sector pay is always a dead cert. Stimulus is another one. And, of course, relative poverty; as in ‘Ireland suffers from a high level of relative poverty’. There are any number of views on this matter, usually quite heated. The ESRI report, ‘Poverty and Deprivation in Ireland in Comparative Perspective’ by Christopher Whelan and Bertrand Maitre is, thankfully, starting to take the heat out of the debate by shedding a little bit of light.
That Ireland has a high level of ‘relative poverty’ or to be more precise, ‘at-risk of poverty’ should not be surprising. On any number of metrics Irish income distribution is highly unequal. However, comparing this high level of at-risk poverty with other EU countries has proven contentious. For instance, in Ireland in 2006, 18.5 percent had incomes of 60 percent of median income or below – one of the higher levels in the EU-15. Portugal experienced a similar level. On this reading, one could argue that Ireland and Portugal had similar levels of inequality – and this would be correct, in their national context.
 Many have legitimately argued that you can’t compare these at-risk poverty levels for the simple reason being at-risk of poverty in Portugal is a more grueling experience than in Ireland. So, the ‘at-risk’ poverty measurement could tell us something about the distribution of income within countries, but tell us little when compared with other countries. However, Whelan and Maitre have provided a valid comparison using the EU median income level. Now we can compare all EU countries to a common standard. And still Ireland doesn’t come out too well.
As can be seen, Ireland, along with the UK, heads the poverty table among its peer group – the non-Mediterranean countries. One in ten are at-risk of poverty using the EU median scale – and this was in 2006, at the height of the boom. It should be noted that the only two countries labelled as ‘liberal’ (the UK is the other) are the ones with highest levels of relative poverty. So, whereas Ireland and Portugal had the same at-risk poverty rate when measured nationally, when measured against the EU median level, Portugal comes in at 46 percent at-risk of poverty – reflecting the fact that it is a very poor country.
The average for ‘social democratic’ countries (Nordic countries plus the Netherlands) is 6.9 percent while ‘corporatist’ or social market economies experienced an average of 6.5 percent (unweighted). Ireland is well above these averages.
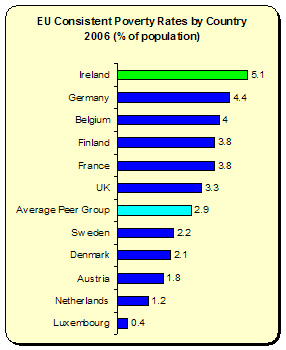 The ESRI paper presents a second measurement – that of consistent poverty. Consistent poverty measures those at-risk of poverty plus experiencing deprivation of at least three internationally agreed categories (e.g. clothes, hot meal, heating, buy presents at least once a year, entertain friends/family at home once a month, etc.). Again, Ireland leads the table among its peer group.
Now let’s fast forward a bit. By 2008 Ireland’s national at-risk poverty rate fell to 14.4 percent. However, the 2010 budget has just cut 4 percent off the income of those dependent of social welfare. How this will play out in relation to the EU averages is difficult to estimate precisely. However, given that wages throughout the EU are showing small but steady increases (3.2 percent over 2009 and 2010 – compared to a projected decline in Ireland), we should expect more Irish falling below the 60 percent median level of EU income.
So, we’re a league leader in at-risk and consistent poverty; and Fianna Fail sees fit to make the situation worse. The fall in income – among workers and social welfare recipients – will only add to the deflationary spiral. And add to higher poverty levels vis-à-vis our peer group in the EU.
Of course, if you start from the premise that people’s living standards are a problem, then this is where you will end up – cutting income, wages, services, etc.
If you start, however, from the premise that people’s living standards are part of the solution, you come up with a different strategy. In the US – Moody’s showed that increasing transfers to those on low-incomes is one of the best things you can do to boost economic growth. The IMF has recently published a paper (thanks to Michael Burke from Progressive-Economy for alerting me to this) showing that transfers – even on a lump sum basis – can boost the economy substantially; benefits which run up to three years. Not only does it boost real GDP, it boosts consumption, net corporate worth and, under certain circumstances, investment. Although these are models for the US, much the same benefit would accrue to the economy here if such policies were enacted.
So, when you start from this premise, you realise that what’s good for people – whether its jobs, new skills, or ending poverty – is good for the economy.
But that’s not how things are done here. No, we cut, we don’t invest; we deflate, rather than reflate. And ultimately we pay – through higher long-term debt, unemployment, emigration, business closures, etc. We fall further and further behind EU norms.
Ah, the Fianna Fail way – if it didn’t exist, we’d have to invent it. To at least show how things should not be done.

Leave a reply to simon Cancel reply