
 ‘There are people who are working right now, who are looking at the possibility of losing their jobs, they cannot save, they cannot build up the savings to cushion potential loss, or potential risk of their job. And, yet, they are paying increasing rates of taxation in order to sustain what is in effect, as identified by the OECD in their 2007 report, the second most lavish system of social welfare spending in the entire OECD.’
Good grief. I had thought that, when Sarah Carey publicly retracted her claim that Ireland had one of the most generous social welfare rates in Europe (after being challenged by Irish Left Review), that that would be the end of the matter. If not that, then Sli Eile’s myth-busting piece using OECD data. But no – Constantin Gurdgiev is making the above claim on RTE’s Prime Time. With the McCarthy Report and IBEC calling for social welfare cuts, it’s clear: some people really have it out for the lowest income group in society. It’s getting obsessive.
So once more let’s pick up our analytical cudgels and see what we can make of this latest claim (all figures are for 2007 – the year the OECD report references.
Synthetic. Artificial. Watch Out.
 Constantine pulls out a chart from the OECD that shows the Irish net replacement rate (NRR – the value of welfare payments as a percentage of average take-home pay) to be one of the highest in the EU – at 72 percent it's right up with there with the Nordic countries. This, on the surface, would indicate that our unemployment welfare rates are high (in other words, if you are unemployed or on lone parents payment, you'll get on average 72 percent of your take-home pay from work). Wow. Our social welfare recipients must really be living it up. Or are they?
The give-away in Constantin’s chart is in the title: ‘synthetic measures of net replacement ratios’. That alone should warn us to tread carefully before making global claims like ‘lavish’. In particular it is based on:
‘After tax and including unemployment, social assistance, family and housing benefits. Unweighted average over 60 months of unemployment for earnings levels of 67 percent and 100 percent of average earnings and four family types (single persons, lone parents, one-earner couples, with and without children.’
That’s quite a synthesis and, as a consequence, it is artificial. This is not to dismiss the OECD’s formulation – but it is analogous to an opinion poll. At a national level, a political opinion poll works as an average – with a small margin of error. But we are warned that the margin of error increases as you look at the provincial levels. And at a constituency level, it is extremely hit-and-miss because it cannot incorporate local characteristics and quirks. To get reliable results at this constituency level, you have to examine and measure the individual constituencies.
Similarly with the OECD synthesis – it works at an international level, setting a benchmark to compare. But to compare individual countries with that benchmark, we have to examine the countries themselves – especially as social welfare regimes are so widely divergent. Indeed, the OECD urges readers of the report to do just that by providing comprehensive details on each country.
It’s a little bit more work, granted. I don’t know whether Constantin is aware of this data but his failure to use it undermines his claim we have the ‘second most lavish system of social welfare spending’ and casts serious doubt over his calculations. For what the OECD says and what Constantin claims are worlds apart. But don’t take my word for it – follow the links I have provided and do your own calculations.
Unemployment Benefit
What does the OECD say about net replacement ratios for those who have become recently unemployed (the ‘initial’ phase of unemployment)? This is a particularly important statistic for Ireland, since we are suffering one of the worst increases in unemployment in the EU. Here are some tables.
(a) Low Paid
 For the low-paid(two-thirds of average wage), the NRR is low. It is well below the average in other EU-15 countries for single people and lone parents. Only in the instance of the couple with an adult dependent and two children does Ireland come close to the average. But it’s still below average in other EU-15 countries.
(b) Average Wage
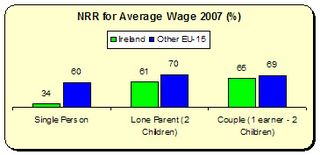 For average wage earners, the story is much the same but for single persons it’s even worse – their NRR is almost half that of other EU-15 countries. [] In other words, unemployment benefit (i.e. Jobseekers’ Benefit) would have to almost double in Ireland for single recipients to reach the average in other EU-15 countries.
There is one important fact to bear in mind. Single persons make up 90 percentof all recipients of Jobseekers’ Benefit (indeed, the total social welfare system is dominated by single persons – 83 percent). Couples make up only a small proportion. So we can conclude that, for those in receipt of unemployment benefit, the overwhelming proportion is living on benefit payments substantially below the norm in other EU-15 countries.
How can anyone call this ‘lavish’?
(b) Long-Term Unemployed
The OECD’s synthetic measurement combines more than just the ‘newly unemployed’. They also examine ‘the long-term unemployed’. But here we have to step carefully and examine the individual ‘constituents’ to get the measurement right, for they make more assumptions about income than under the ‘newly’ unemployed.
A major element in the Irish calculation is the ‘Housing Benefit’. For the OECD, this equates to cash contributions to rental accommodation only. The OECD goes to some length to explain the difficulties in comparing such benefits. That’s because housing benefits throughout the OECD countries can be delivered through other programmes besides social welfare, and by a mix of national/federal, regional and local governments (in some cases, the OECD uses a city or a region as a proxy for the whole country). As well, the different qualifying conditions (some benefit payments are based on floor size, others on age, etc.) make uniform comparisons difficult.
To get over these problems, the OECD is forced to make a number of assumptions. Firstly, it assumes a uniform housing cost of 20 percent of average wage – though in 2007 it is arguable that Irish housing costs as a proportion of an average wage were much higher than in other countries (and it doesn’t take into account that many recipients don’t have housing costs such as older workers who own-outright).
In addition, the OECD assumes that all long-term unemployed and lone parents receive Housing Benefit. This rate is substantial in the Irish calculation of the NNR. It amounts to nearly a third of the actual unemployment payment rate. How valid are these assumptions for Ireland? Not very.
-
Most long-term unemployed do not receive rent supplement – in 2007 there were only 864 who received rent supplement for over five years.
-
Most lone parents do not receive it either. Only 17 percent of all lone parents receive rent supplement and of those that did, only 571 held a rent supplement for over five years.
Indeed, of all the unemployed and lone parents (the categories which the OECD is concerned with), less than 14 percent receive Housing Benefit. So, bearing this mind – that the NRR is very much over-stated for the majority of Irish long-term unemployed and lone parents – what do we find?
 Irish rates exceed the average of other EU-15 countries as a ratio of average wage. The reason for this is that many EU countries operate a scale – the longer unemployed the more one’s rate is reduced. It goes to the extreme where Greece and Italy provide no assistance to the unemployed and lone parents by the fifth year (possibly a historical-cultural reliance on family/community?). This is why I have included a third calculation to exclude these exceptional cases. However, each of the Irish categories would be substantially reduced if the Housing Benefit were excluded – to reflect the fact that few long-term unemployed and lone parents actually receive the Benefit.
In the following table I have attempted to do this, but this should only be taken as indicative as this is my own extrapolation. I based the Irish figure on the Housing Benefit data in the Tax/Benefit  calculator – though this is specifically for short-term unemployed (regardless, rent supplement doesn’t increase with duration). The other EU-15 averages are based on a average 7 percent reduction based on the level of Housing Benefit in other countries(some countries don’t have a national housing benefit).
When excluding Housing Benefit we see that average Irish NRR is comes closer to the average of other EU-15 countries (especially when Greece and Italy are excluded). I’m open to correction on this exercise, but in any event, given that the Housing Benefit the OECD uses for Ireland is the highest of any EU country we would expect a decline in relation to other countries when that benefit is excluded.
The Deserving Poor
Even so, Constantin certainly gets worked up about the ‘burden’ this is imposing on all us. In words that would have made a Poor Law administrator proud:
'The real tragedy of Irish welfare system is that we tend to lump together people on unemployment benefits with: long-term welfare recipients (often generational ones) who are able-bodied working age adults; and long-term disability aid recipients. This is simply immoral and wrong economically . . . Unemployed seek employment. Welfare recipients do not. Elderly and disabled have a real claim to make on the society for help . . . Those who can work, but choose not to have no such claim to make. Our unemployment assistance rate is below our long term welfare rates. This is farcical. It is an incentive for some to move off unemployment roster and out of the labour force . . . we are paying a number . . . of people who made it their career to milk the taxpayers.'
And how large is this cohort of ‘milkers’?
‘ . . no one can tell us how big it is . .’
Oh.
Constantin shouldn’t worry too much. First, the only social welfare rates higher than unemployment assistance are pensioners, carers, and occupational injuries beneficiaries. There is no income incentive to move off the employment roster, for the only categories with higher payments have specific conditions.
Second, long-term unemployment assistance recipients (over three years) represent only 12 percent of the Live Register, and less than 2 percent of all social welfare recipients. Are there ‘milkers’ among them? No doubt – there are ‘milkers’ in all walks of life (just look at the senior positions in the banking sector). But there’s also a good chance you will find more people with serious health and addiction problems, literacy problems, and severe skill shortages.
Third, if life on long-term unemployment assistance is such a fun-ride, why aren’t more doing it? Between 2003 and 2007, the numbers remained the same. Maybe word hasn’t gotten about.
Fourth, those ‘deserving’ categories that Constantin refers to – those on the unemployment roster, the disabled, the elderly (and, I’m guessing he would include those on enterprise supports since they are trying to get back to work; carers as well, since they also work) – all these make up 86 percent of all social welfare recipients. The two major categories outside this ‘worthy’ lot are lone parents and supplementary recipients. But not to worry – there is no income incentive to be in these categories: they receive the same as someone on unemployment. The scope for ‘milking’ is pretty limited, and hardly ‘incentivised’.
At root, this ‘deserving poor’ argument is extremely divisive. It mirrors the them-and-us debate over public and private sector workers. It is full of value-laden terms but few, if any, facts. You merely have to throw out an assertion and hope the desire to find a scapegoat for our economic ills will taint all those who happen to be on social welfare (and as Peter Connell and WBS show point out – there are many who will fan this particular flame – again, regardless of facts).
Back to Constantin’s Claim
Constantin claims our system is ‘lavish’. He bases this claim on the synthetic measurement that shows Ireland with a NRR of 72 percent. But, taking the OECD’s offer to investigate the individual country under review (i.e. Ireland) we find the following.

As can be seen, only two categories reach or exceed the OECD’s synthetic NRR ratio for Ireland – newly unemployed couples on low-pay (it’s still below the average in other EU-15 countries) and couples on long-term unemployed with Housing Benefit. Remember, it is this synthetic measurement that Constantin bases his claim that the 'Irish social welfare system is the second most lavish'.
Given that most unemployment benefit recipients are single, given that Ireland in 2007 had a low proportion of long-term unemployed, given that most unemployed and lone parents don’t receive Housing Benefit – we can see that the synthetic OECD NRR for Ireland is clearly over-stated. Is this the fault of the OECD? No, anymore than you can blame a national opinion poll for not being accurate in one constituency. The blame lies with those who make unsubstantiated claims and ignore the data that the OECD systemically presents.
Don’t Defend – Go on the Offensive
There’s nothing in the OECD data to suggest that Irish social welfare rates are high by EU-15 standards. If anything, the vast majority of unemployed and lone parents get substantially less than their counterparts in other EU-15 countries.
But that won’t matter. The momentum towards cutting social welfare is almost irresistible. Pointing out inconvenient facts won’t alter that – we’ll just get met with that exasperated question:
‘But we’re going broke – we have to cut something. Why not poor people?’
We have equity on our side. In these macho macroeconomic times, though, we need more There is a simple counter to that exasperated question: cutting social welfare rates will not save money, but it will undermine the economy’s ability to crawl out of the recession and get the fiscal deficit under control.
The ESRI has not simulated the economic impact of a 5 percent cut in social welfare rates. But it did simulate a cut of 5 percent in public sector wages. What did it find? Such a cut would drive down the GNP by 0.3 percent, cut consumption by 0.8 percent and even increase unemployment – by some 2,000 people. And how much would the deficit be reduced by? 0.3 percent.
Now, imagine if that same exercise were done for cutting social welfare? This is a group with the highest propensity to spend as a proportion of their income. Therefore, we should expect consumption to be cut even further – probably substantially so. As a consequence we would expect the GNP to decline further and unemployment to rise higher. And if that happens, the fractional benefit to the fiscal deficit would be even less.
We must find a way to articulate this simple proposition: that cutting public expenditure cannot be equated with cutting the fiscal deficit. The former is a budgetary exercise; the latter is the result of managing the economy during a downturn. This is not an abacus-job. For cutting public expenditure during a recession makes the economy react in a very, very bad way.
So, not only do we have equity on our side, not only do we have proper international comparisons on our side – we also have economic strategy on our side.
Let’s use all these. Before it’s too late.
A Data Postscript
Here’s another little item [] to show how ‘lavish’ our social welfare system is. Average childcare costs throughout the OECD amount to 8 percent of net income for lone parents on low pay. In Ireland it is 45 percent. Wouldn’t it be better to address this disincentive to work (through an affordable childcare network supported by the public sector) rather than rant on about milkers and shirkers and lay-abouts?
Just a thought.

Leave a reply to Michael Taft Cancel reply